Written by Harry Roberts on CSS Wizardry.
Table of Contents
A thing I see developers do time and time again is make performance-facing
changes to their sites and apps, but mistakes in how they measure them often
lead to incorrect conclusions about the effectiveness of that work. This can go
either way: under- or overestimating the efficacy of those changes. Naturally,
neither is great.
Problems When Measuring Performance
As I see it, there are two main issues when it comes to measuring performance
changes (note, not improvements, but changes) in the lab:
- Site-speed is nondeterministic. I can reload the exact same page
under the exact same network conditions over and over, and I can guarantee
I will not get the exact same, say, DOMContentLoaded each time. There are
myriad reasons for this that I won’t cover here. - Most metrics are not atomic: FCP, for example, isn’t a metric we can
optimise in isolation—it’s a culmination of other more atomic metrics such as
connection overhead, TTFB, and more. Poor FCP is the symptom of many causes,
and it is only these causes that we can actually optimise. This is
a subtle but significant distinction.
In this post, I want to look at ways to help mitigate and work around these
blind spots. We’ll be looking mostly at the latter scenario, but the same
principles will help us with the former. However, in a sentence:
Measure what you impact, not what you influence.
Indirect Optimisation
Something that almost never gets talked about is the indirection involved in
a lot of performance optimisation. For the sake of ease, I’m going to use
Largest Contentful Paint (LCP) as the example.
As noted above, it’s not actually possible to improve certain metrics in their
own right. Instead, we have to optimise some or all of the component parts that
might contribute to a better LCP score, including, but not limited to:
- redirects;
- TTFB;
- the critical path;
- self-hosting assets;
- image optimisation.
Improving each of these should hopefully chip away at the timings of more
granular events that precede the LCP milestone, but whenever we’re making these
kinds of indirect optimisation, we need to think much more carefully about how
we measure and benchmark ourselves as we work. Not about the ultimate outcome,
LCP, which is a UX metric, but about the technical metrics that we are impacting
directly.
We might hypothesise that reducing the amount of render-blocking CSS should help
improve LCP—and that’s a sensible hypothesis!—but this is where my first point
about atomicity comes in. Trying to proxy the impact of reducing our CSS from
our LCP time leaves us open to a lot of variance and nondeterminism. When we
refreshed, perhaps we hit an outlying, huge first-byte time? What if another
file on the critical path had dropped out of cache and needed fetching from the
network? What if we incurred a DNS lookup this time that we hadn’t the previous
time? Working in this manner requires that all things remain equal, and that
just isn’t something we can guarantee. We can take reasonable measures (always
refresh from a cold cache; throttle to a constant network speed), but we can’t
account for everything.
This is why we need to measure what we impact, not what we influence.
Isolate Your Impact
One of the most useful tools for measuring granular changes as we work is the
User Timing
API. This
allows developers to trivially create high resolution timestamps that can be
used much closer to the metal to measure specific, atomic tasks. For example,
continuing our task to reduce CSS size:
  ...

  performance.mark('CSS Start');

   rel="stylesheet" href="app.css" />


    performance.mark('CSS End');
    performance.measure('CSS Time', 'CSS Start', 'CSS End');
    console.log(performance.getEntriesByName('CSS Time')[0].duration)


  ...
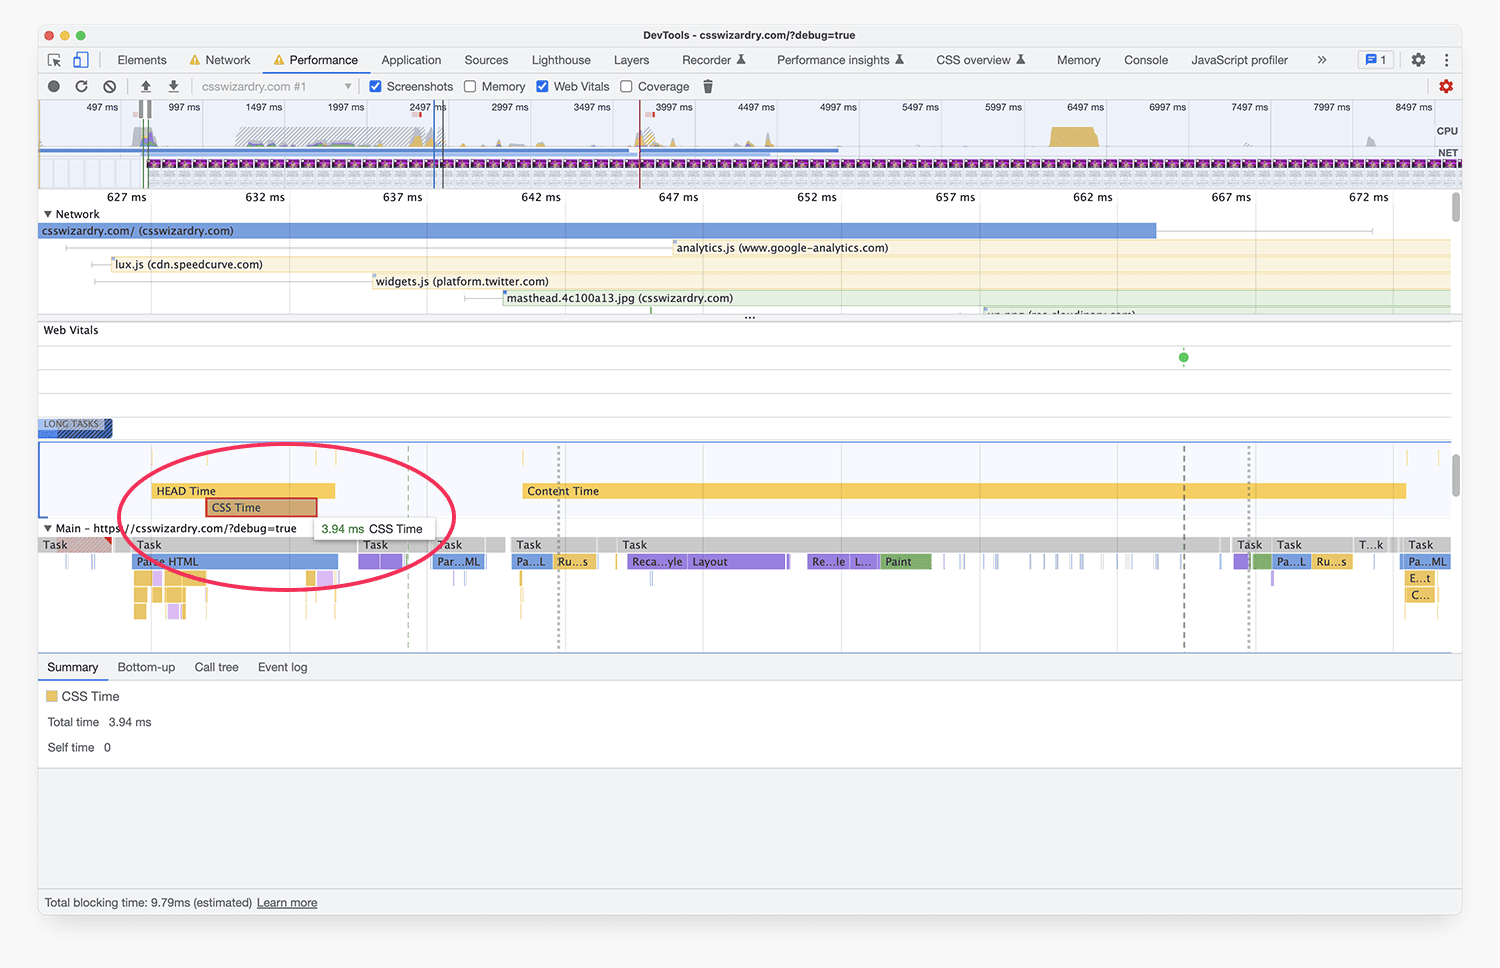
This will measure exactly how long app.css blocks for and then log it out to
the console. Even better, in Chrome’s Performance panel, we can view the
Timings track and have these measures (and marks) graphed automatically:
The key thing to remember is that, although our goal is to ultimately improve
LCP, the only thing we’re impacting directly is the size (thus, time) of our
CSS. Therefore, that’s the only thing we should be measuring. Working this way
allows us to measure only the things we’re actively modifying, and make sure
we’re headed in the right direction.
If you aren’t already, you should totally make User Timings a part of
your day-to-day workflow.
On a similar note, I am obsessed with head
tags. Like,
obsessed. As your head is completely render blocking, you could proxy
your head time from your First Paint time. But, again, this leaves us
susceptible to the same variance and nondeterminism as before. Instead, we lean
on the User Timing API and performance.mark and performance.measure:
  performance.mark('HEAD Start');

  ...


    performance.mark('HEAD End');
    performance.measure('HEAD Time', 'HEAD Start', 'HEAD End');
    console.log(performance.getEntriesByName('HEAD Time')[0].duration)
This way, we can refactor and measure our head time in isolation without also
measuring the many other metrics that comprise First Paint. In fact, I do that
on this
site.
Signal vs. Noise
This next example was the motivation for this whole article.
Working on a client site a few days ago, I wanted to see how much (or if)
Priority Hints might improve their LCP time.
Using Local Overrides,
I added fetchpriority=high to their LCP candidate, which was a simple
default).
I created a control, reloaded the page five times, and took the median LCP.
Despite these two defensive measures, I was surprised by the variance in results
for LCP—up to 1s! Next, I modified the HTML to add fetchpriority=high to the
Again, I was surprised by the level of variance in LCP times.
The reason for this variance was pretty clear—LCP, as discussed, includes a lot
of other metrics, whereas the only thing I was actually affecting was the
priority of the image request. My measurement was a loose proxy for what I was
actually changing.
In order to get a better view on the impact of what I was changing, one needs
a little understanding of what priorities are and what Priority Hints do.
Browsers (and, to an extent, servers) use priorities to decide how and when they
request certain files. It allows deliberate and orchestrated control of resource
scheduling, and it’s pretty smart. Certain file types, coupled with certain
locations in the document, have predefined
priorities, and developers
have limited control of them without also potentially changing the behaviour of
their pages (e.g. one can’t just whack async on a and hope for the
best).
Priority Hints, however, offer us that control. Our options are fetchpriority=
high: sets initial priority to High;auto: effectively redundant—it’s the same as omitting the attribute
altogether;low: sets initial priority to Low.
Now comes the key insight: modifying a file’s priority doesn’t change how soon
the browser discovers it—that’s not how browsers work—but it does affect how
soon the browser will put that request out to the network. In browserland, this
is known Queuing. Modifying a file’s priority will impact how long it is spent
queuing. This is what I need to be measuring.
Let’s take a look at the before and after:
Before, without Priority Hints:

After, with Priority Hints:

Remember, the only thing that Priority Hints affects is Queuing time, but if we
look at the two screenshots, we see huge variance across almost all resource
timing phases. Judging the efficacy of Priority Hints on overall time would be
pretty inaccurate (we’d still arrive at the same conclusions—Priority Hints do
help improve LCP—but via the wrong workings out).
Final Thoughts
There is a lot of indirect work when it comes to optimising certain metrics.
Ultimately, individual tasks we undertake will help with our overall goals, but
while working (i.e. writing code) it’s important to isolate our benchmarking
only to the granular task at hand. Only later should we zoom out and measure the
influence those changes had on the end goal, whatever that may be.
Inadvertently capturing too much data—noise—can obscure our view of the progress
we’re actually making, and even though we might end up at the desired outcome,
it’s always better to be more forensic in assessing the impact of our work.
It’s vital to understand the remit and extent of the things we are changing.
It’s vital to benchmark our changes only on the things we are changing.
It’s vital to measure what you impact, not what you influence.