When analyzing a waterfall, look for patterns and issues that could be impacting your site’s performance.
Here are the three most common issues:
Render-blocking resources
Render-blocking resources are resources that delay the initial rendering of the page.
Consider this code example:
    Online Shop


    Cookie banner
In this case, the cookie-banner.js script blocks the rendering of the element.
In fact, many websites include render-blocking resources in the element of the HTML document, which can delay the rendering of the entire page.
Whether it's CSS or JavaScript, DebugBear highlights render-blocking resources in the network request waterfall, making it easier to visualize where these issues occur:
In the case of render-blocking JavaScript files, you can apply the async attribute to the element to prevent it from blocking the rendering of the page.
Long request chains
Long request chains occur when resources are dependent on each other, creating a cascade of requests.
Here's an example of a request chain:
index.html (the first request):
app.js (the second request):
import analytics from "./analytics.js";
import home from "./home.js";

document.addEventListener("DOMContentLoaded", () => {
  analytics.init();
  home.init();
});
home.js (the third request):
function init() {
  const response = await fetch('/message');
  const message = await response.text();
  document.querySelector('h1').textContent = message;
}

export default { init };
This example shows an index.html file that loads an app.js file, which in turn loads a home.js file.
While this example is a simplification, it illustrates how long request chains can affect the page load experience.
Note:
The fact the /message endpoint is called only after the DOMContentLoaded event further exacerbates the issue because DOMContentLoaded is not needed to fetch the message over the network.
Browsers are very good at looking ahead and fetching resources that can be discovered from the main HTML file, but when long request chains are used, this ability is lost.
Missed preloading opportunities
Sometimes, critical resources aren't loaded as early as they could be.
Often, early loading can be achieved by removing a critical resource from a long request chain and making sure that it's discoverable from the main HTML document; however, there are times when this isn't possible.
If a long request chain is unavoidable, you can mitigate the issue by using the element for a critical resource, such as an LCP image element.
For example, following on from the previous long request chain example, the index.html file could be updated to preload the home.js file and the message endpoint, as shown below:
Note:
You must not overuse because it can lead to unnecessary resource downloads and increased bandwidth usage.
Chrome DevTools has a "LCP image loaded X seconds after the earliest start point" message in the Performance Panel.
This can help you identify missed preloading opportunities.
To locate this feature, use DevTools to make a performance recording of your page load, and then open up the LCP Request Discovery section from the Performance Insights sidebar.
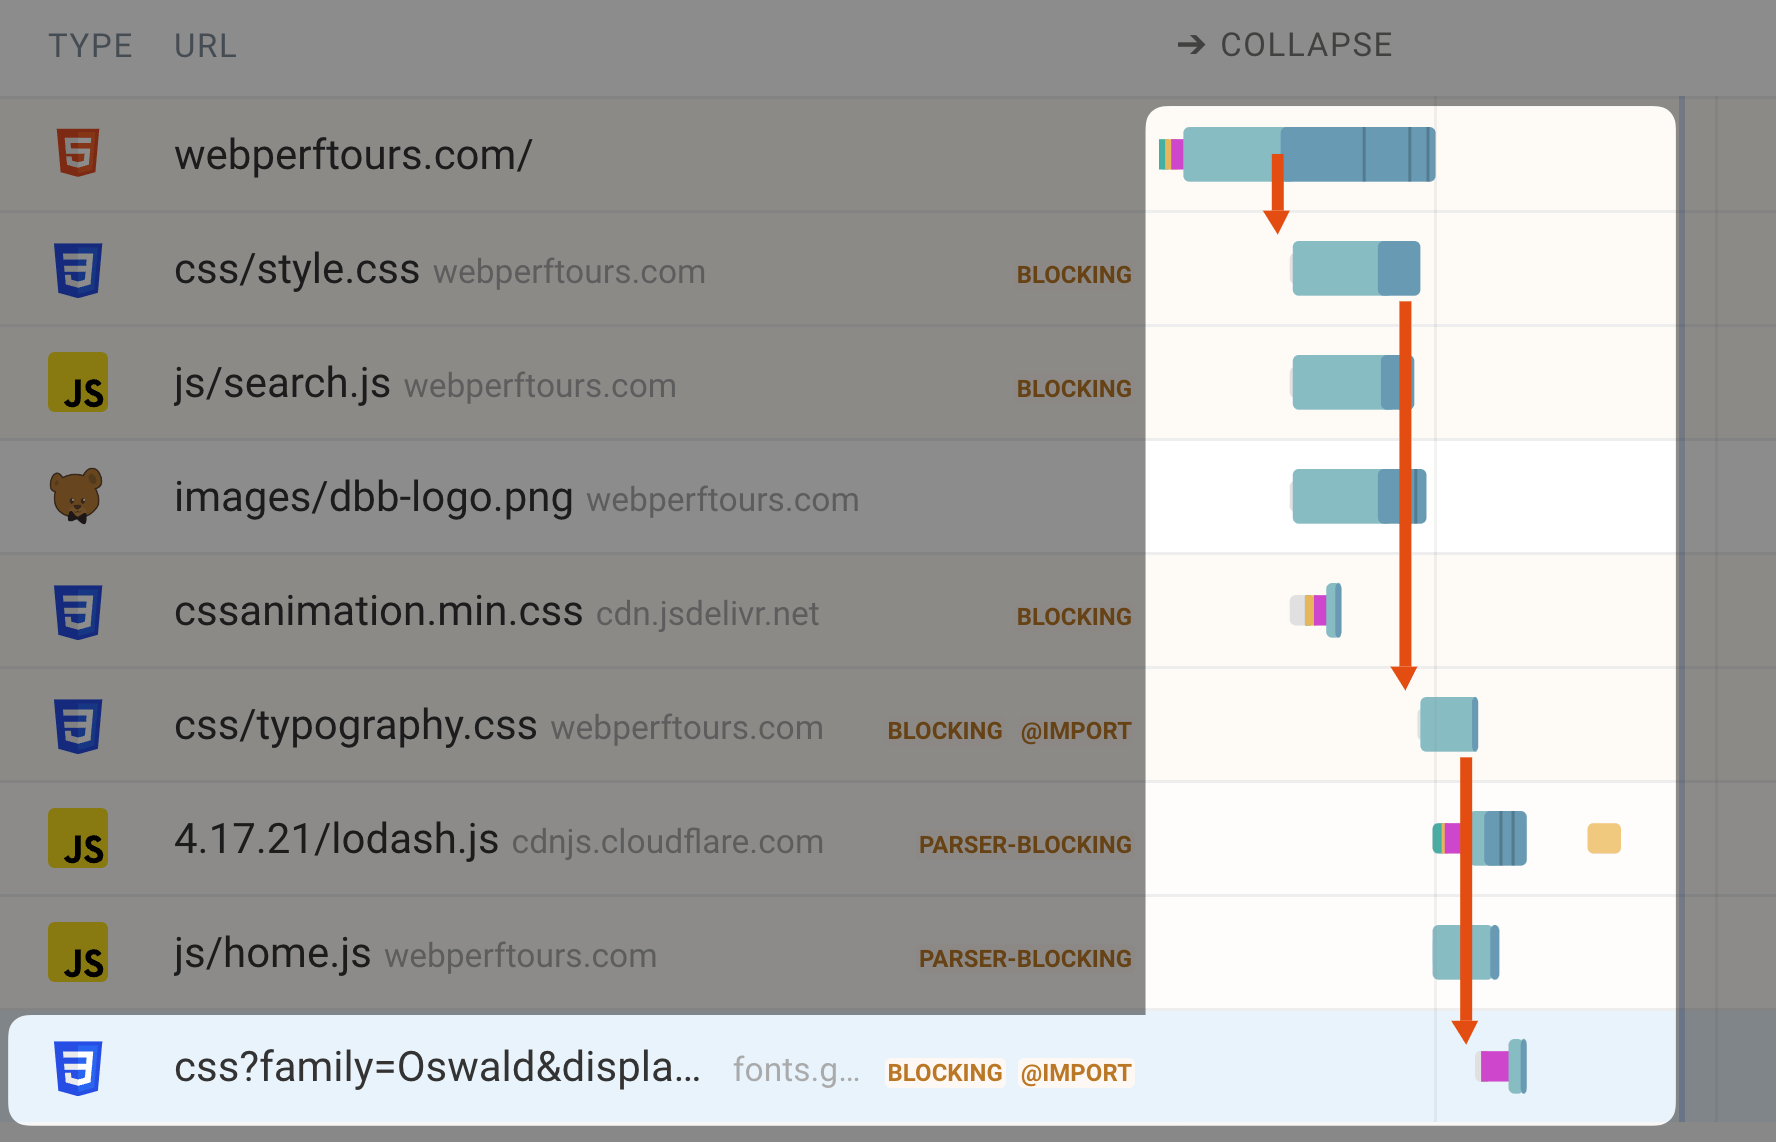
You can find long request chains in a DebugBear Request Waterfall view when you click on an individual resource, and toggle the "Show request initiator chain" setting to on.
The request chain in the following image shows that a font file (the last resource) is initiated by typography.css, which in turn is initiated by style.css, which is requested from the main document.